In the first part of our expedition report, we focused on project planning and execution. In the following, we will describe the initial findings in comparison to Alfred Wegener’s insights.
In the initial phase of the project, we focused on scientifically analyzing the existing historical data. The digitization of Wegener’s works was a necessary prerequisite, for which we received expert support from the university library. Below, we provide a few examples of how we utilized these data, while more detailed information can be found in a recently published paper.
Comparison of weather data
One logical application is the comparison of weather data recorded by the Wegener expedition with reanalysis products (gridded datasets calculated from a limited number of observations). There are only a few reanalysis products that date back as far, and one widely used product is the “20th Century Reanalysis,” which is available in two versions from different institutions (CERA-20C; 20CRv3). Since Wegener’s data was not incorporated into the reanalyses, it is ideal for their validation. We have shown that the trend of local temperatures aligns surprisingly well, although not capturing the full complexity, as expected (see Figure 1).

Figure 1: Comparison of 2m temperature from two 20th-century reanalyses (CERA-20C from ECMWF, 20CRv3 from NCEP-NOAA) with the measurement data from the Wegener expedition for the station in the fjord (FS). (© Abermann et al. 2023)
Comparison of snowlines
Another comparison that we were able to make based on historical data, utilizing new satellite-based evaluations, is related to reports on the elevation of the snowline at the end of the summer season. In Figure 2, we present the derived snowline elevation from the expedition years 1929 and 1930 (note that different reports make it difficult to precisely describe the data for 1930; this serves as a good example of how uncertainties must be dealt with). We compare these with assessments based on MODIS satellite data. We demonstrate that the elevation of the snowline in 1929 and 1930 was comparable to the most extreme years of the 21st century. This is relevant because reliable information from the pre-satellite era is rare.

Figure 2: The elevation of the snowline based on MODIS data (blue shades) and the reconstructed values from Wegener’s reports for 1929 (red) and 1930 (yellow). (© Abermann et al. 2023)
Temperature comparisons
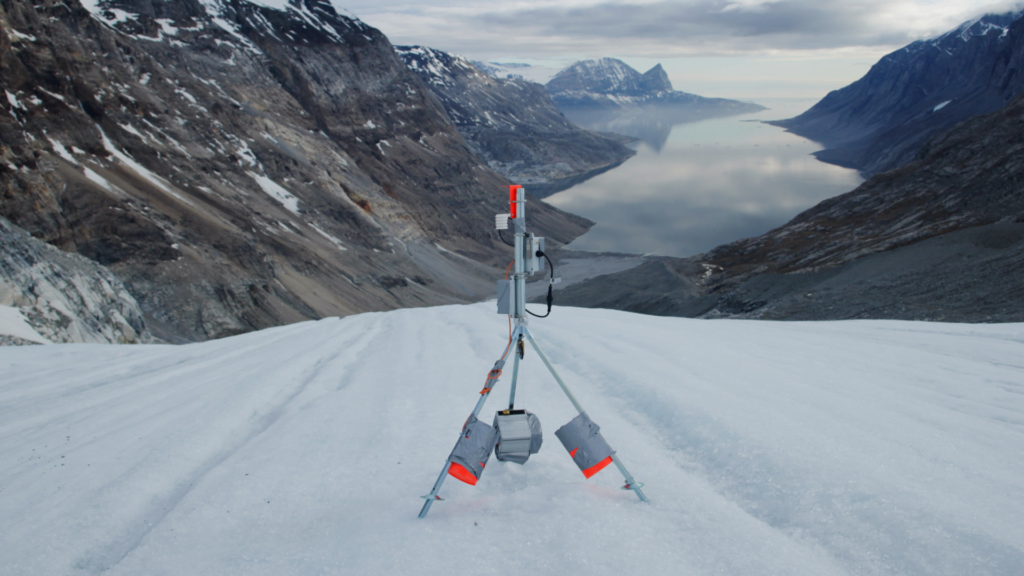
We have also obtained initial results based on our own measurements. One example of this is the vertical drone flights that we regularly conducted during the summer expedition. Details of the methodology can be found in a recently published article. To resolve the spatial structures, we first compared the measured temperature during a flight with the temperature measured at the reference station FS located directly on the coast during the same period. We then interpolated the calculated temperature anomaly relative to FS along the valley axis. Figure 3 illustrates the spatial distribution of the temperature anomaly on July 8, 2022. Areas can be identified that are warmer than the mentioned reference station (in red), indicating the presence of temperature inversions. It is particularly relevant to consider how the changed glacier surface (volume loss) and the interaction between the fjord and the glacier influence this stratification.

Figure 3: a) General map of the study area with the positions of the installed instruments (AWS – weather station, AblWeg/SWeg – ablation measurement, UAV – drones, AT/RH – temperature/humidity sensors). A-F mark the positions of the individual ascents. b) shows the spatial distribution of temperature anomalies, labeled with the time and measured temperature at the reference station FS on the coast. (© Abermann et al. 2023)
Apart from the initial results focusing on climatology, we are currently producing the first findings applying methods from the field of artificial intelligence (AI) to our research questions. While AI methods have recently proven their utility for scientific inquiries, considering the hype around them, it is important to maintain a healthy level of skepticism. Our project and the utilized data offer an excellent opportunity to test their performance.
We began with simple questions: What aspects of large-scale atmospheric circulation determine the local runoff in Qaamarujup Fjord? Or more specifically: Which areas determine, when considering the 500 hPa geopotential height (a variable describing air pressure patterns), whether there is above-average or below-average runoff from meltwater in the fjord? We have addressed this problem using various methods – established “classical” statistical methods such as k-means clustering, as well as newer methods from the field of explainable AI (XAI). Preliminary results can be seen in Figure 4, where a) displays the outcome with established cluster methods. Dark areas indicate a greater influence on runoff compared to light areas. In Figure 4b, the results from 9 different XAI methods are shown. They present a different picture, with varying regions showing different strengths of associations. This could mean that the simpler classical method is unable to capture the complex relationships accurately or that the XAI methods are not suitable for this specific research question. Investigations in this regard are still ongoing, and a definitive answer cannot be provided at this stage.

Figure 4: Comparison of various statistical and AI methods for the question of which regions of the large-scale atmospheric circulation drive the runoff in Qaamarujup Fjord. a) Classical clustering method, b) 9 different XAI methods.
Next Steps
The project has inherent flexibility in terms of its content, which is typical for basic research, allowing for a refreshing research routine. Therefore, the next steps are not set in stone but depend on our interdisciplinary team’s ability to recognize the potential of the subject matter. Possible paths include high-resolution modeling of the valley atmosphere with variable glacier coverage. This could help elucidate how atmospheric stratification changes with more or less ice and its proximity to or distance from the ocean. Beyond stratification, this has implications for melt rates, which can be compared and validated against historical ablation data. It will be intriguing to investigate the clarity of such results and discern the extent to which measurement inaccuracies or deviations from reality in model inputs contribute to them.
Additionally, we have planned collaborations with dynamic ice modelers in the project to better describe glacier history. What ice dynamics are necessary to reproduce the geometry we know fairly well from the past, and can we learn something from it about future developments? Can the findings from an outlet glacier (randomly and opportunistically selected) of the Greenland Ice Sheet be applied to others, and can an improved understanding of individual drivers (ocean, fjord ice, atmosphere, dynamics) lead to improved predictions of future melt rates? Or are the local effects negligible in the broader picture? Questions like these will continue to engage us in the coming years.
Building on the initial investigations into XAI, we will apply additional AI methods and modeling techniques throughout the project. Our overarching vision is to provide glaciology and meteorology with a new toolkit specifically developed for our research questions, but also easily expandable to other areas. The strength of AI methods lies in pattern recognition, handling large datasets, and the ability to evaluate complex and nonlinear relationships. In meteorology and geosciences in general, natural phenomena are often complex and can only be described through approximations. As a result of our work on XAI methods, we will gain insight into the inner workings of AI algorithms, allowing us to draw conclusions about what was crucial in the data to achieve a particular result. Trained algorithms have already assisted us in the digitization of historical data sources, particularly in text recognition. In the next step, we aim to further enhance AI support in data analysis. The possibilities are diverse, including combining physical laws with AI algorithms to handle smaller datasets with appropriate prior knowledge. Similarly, causal models and “causal discovery” techniques can help reveal previously undiscovered relationships in the datasets. Our fundamental intention is always to select the best tool for each specific research question and to explore where AI is helpful and where it reaches its limits.
Conclusion
For over a year, we have been working enthusiastically and joyfully on our project, and we have already learned a great deal. Above all, perhaps, we have been sobered by the realization of how challenging it is to carry out a project of this scale in a remote area like Greenland. We have learned how much depends on luck and precise timing, as well as the constant need for replanning and adaptation. Our motivation is consistently renewed by the privilege of working based on our own interests. Thus, this article can also be seen as a plea for basic research: we do not have to (and probably cannot) develop a “product” that must eventually compete in any market. Rather, we want to learn from our curiosity and hopefully generate knowledge – not least inspired by great role models like Wegener.
A slightly modified version of this article will be published in GeoGraz, the journal of the Institute of Geography and Regional Science (Institut für Geographie und Raumforschung).
Media information
Written by Jakob Abermann.
Contact: use our contact form.
Photos, when not stated otherwise: © A. Trügler
About the scientific author
Jakob Abermann, University of Graz, Austria