Researchers from the APRI at University of Graz found new evidence of anthropogenic warming beyond the natural climate variability over the Greenland Ice Sheet.
The group of researchers from the University of Graz and APRI members, Tiago Silva, Jakob Abermann, Sonika Shahi and Wolfgang Schöner, recently published in The Cryosphere Discussions a regional characterization of inter-decadal changes in large-scale atmospheric structures in the Northern Atlantic.
These changes have impacted the surface energy budget components like the warming and moistening at the surface and elevated levels of the atmosphere over the Greenland Ice Sheet (GrIS). The study was also developed in collaboration with the Institute for Marine and Atmospheric Research Utrecht from the University of Utrecht.
Climate oscillations – an overview
To investigate prevailing atmospheric circulation patterns over the GrIS, they used climate oscillations indexes such as the North Atlantic Oscillation index (NAO) and the Greenland Blocking index (GBI). Indexes are derived mathematically in order to describe the (internal) climate variability over a region (or regions) of the earth. As atmospheric variables are strongly interlinked, indexes are able to quantify several anomalies in the climate system. For example, NAO is a measure of surface atmospheric pressure difference, which provides insight about the polar jet stream strength (depicted in the Figure below) and storm track; the GBI measures the thickness of the lower-troposphere (approx. 5 km a.s.l.) over Greenland and sheds a light on the near-surface winds’ speed. However, there are other factors influencing the climate system that are not fully captured by indexes. Indexes are commonly unitless and are classified into positive, neutral and negative phases. The NAO relies on the dipole Azores high- and Icelandic low-pressure system: a positive phase (+NAO) indicates that these two large-scale systems are positioned in accordance and it strengthens the westerly flow in the Northern Atlantic, while the negative NAO phase (-NAO) represents a contrasting shift of these large-scale systems in the region, with relative weakening of the westerly flow in the Northern Atlantic and enhancement of the meridional heat and moisture transport towards the Arctic. A positive GBI (+GBI), on the other hand, indicates a thickening of the lower-troposphere over Greenland, typically indicative of anti-cyclonic conditions in the vicinity of Greenland (delimited by the orange domain in the Figure), while a negative phase (-GBI) suggests that the lower-troposphere over Greenland is relative thinner and predominantly cyclonic.
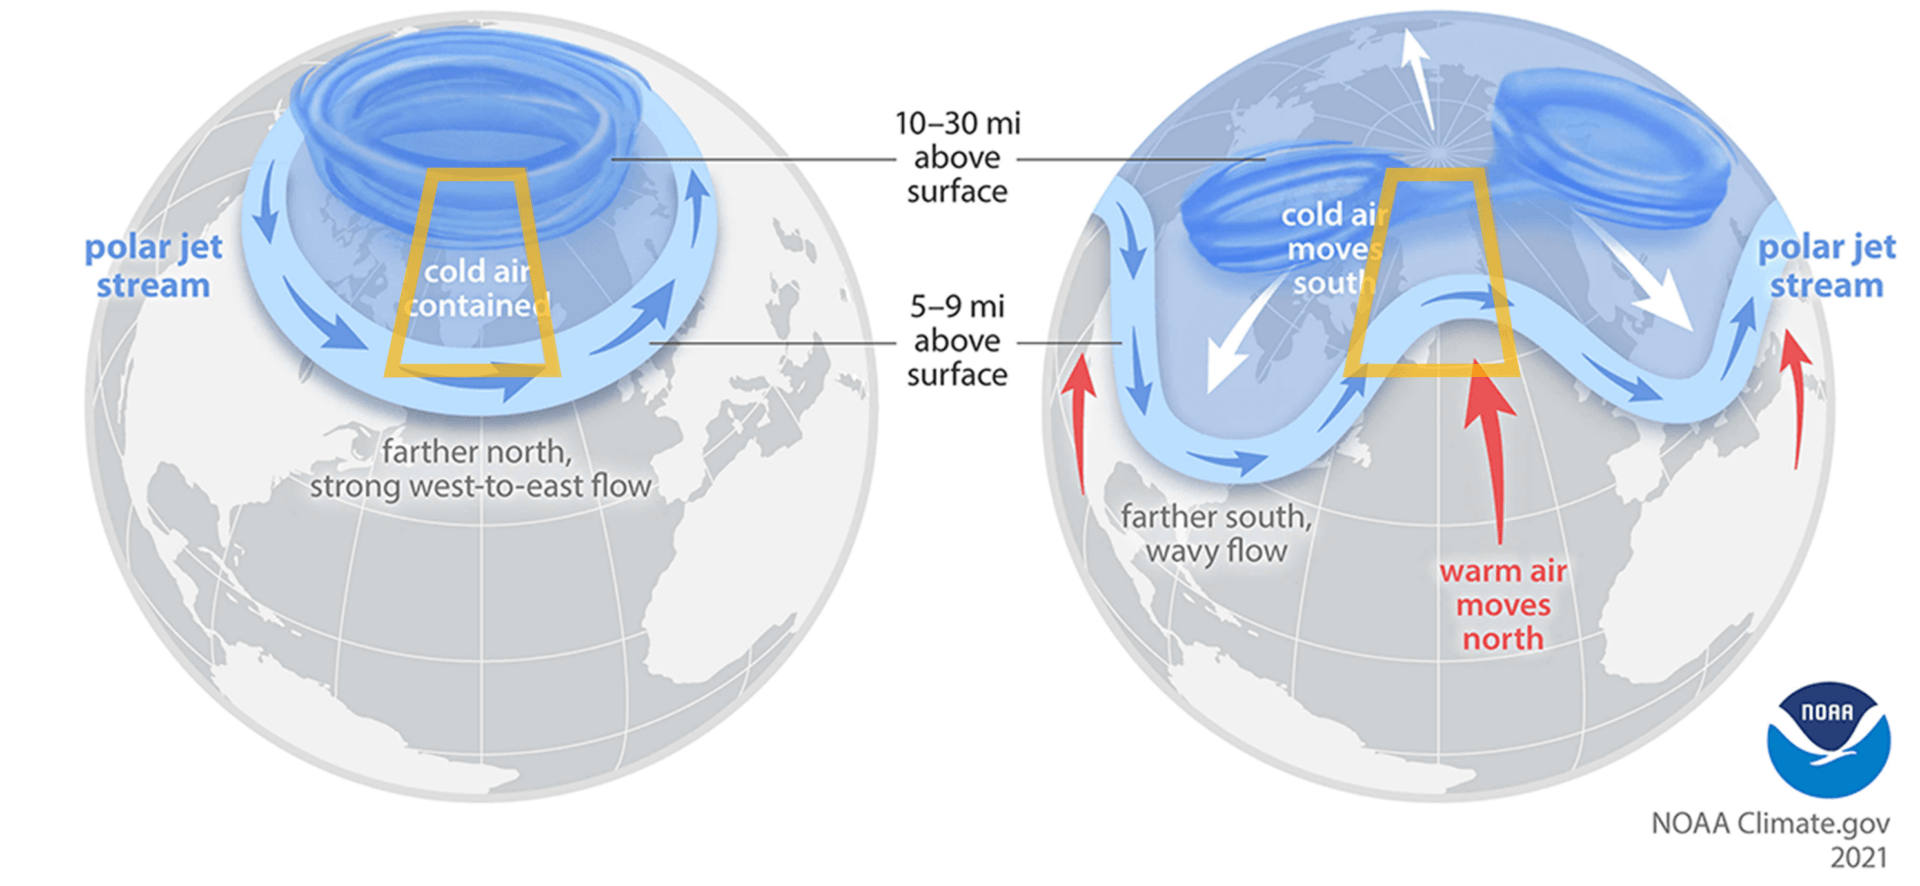
Polar vortex conceptual scheme. The atmospheric circulation in the left scheme holds the cold air in the Arctic, and it is commonly characterized by +NAO or -GBI phase. The right scheme shows dynamic exchange of heat and moisture between mid and high latitudes. It is often characterized by -NAO or +GBI. The subtle orange area locates Greenland. (from NOAA)
In addition to these climate oscillation indexes, they used the vertically integrated atmospheric water vapor (total precipitable water in the atmospheric column) over Greenland. Based on a novel approach, they were able to categorize large-scale circulation patterns over Greenland. The categorization of large-scale circulation patterns is not new – NAO and GBI are widely used with the exact same purpose of categorizing key atmospheric patterns (e.g. temperature and precipitation). However, as NAO and GBI are quantified by different atmospheric variables in different regions, the impact and interpretation of these two indexes separated is somewhat different. Therefore, the classification method from this study stands out in comparison with existing studies. They named the classification as the North Atlantic influence over Greenland (NAG). In contrast to GBI and NAO, NAG differs from classifications based on percentile thresholds. The positive phase of NAG (+NAG) is connected to the anomalously thick lower-troposphere (+GBI) and anomalously negative surface atmospheric pressure difference over the Northern Atlantic (-NAO), as well as high integrated atmospheric water vapor. The negative phase of NAG (-NAG) corresponds to conditions similar to -GBI and +NAO, with anomalously low amounts of water vapor in the atmosphere. In order to assess the thermodynamic impacts on surface energy components as depend on the NAG phase, 62 years (1959-2020) of atmospheric and surface variables over the GrIS were obtained from a high-resolution (5.5 km) regional climate model.

Winter and summer temperature (at 2m) changes in recent decades (1991-2020) with respect to the early period (1959-1991). Summit Station and South Dome are marked as big and small triangles. Stippled regions indicate areas with a confidence level greater than 90 % (means that the result is reliable with a probability of at least 90 percent) (based on the Wilkoxon rank-sum test for unpaired sets). Changes in temperature over the adjacent seas area also shown as colored numbers. (from Silva et al. 2022)
The study starts by introducing the NAG with a comparison with NAO and GBI. Using statistical methods, they show that NAG is able to capture better winter and summer relationships between atmospheric (and surface) variables under prevailing anti-cyclonic conditions in the accumulation zone of the GrIS (the area where more mass is gained than lost). In the summer ablation zone (the area where more mass is lost than gained), the NAG classification is similar to NAO or GBI alone.
As the extension and the magnitude of Greenland surface mass loss has increased since the 1990s, they decided to investigate how variables such as the air temperature changed in each NAG phase in recent decades (1991-2020) with respect to the early period between 1959 and 1990.
Changes in seasonal atmospheric forcing
According to NAG, all atmospheric configurations in winter and summer have become warmer and moister. The warming magnitude and spatial extension are linked with season and NAG phase. Winter has warmed up to 6°C in the northern parts of Greenland under +NAG, with similar warming patterns under opposite NAG.
Although the summer air temperature has not increased as much as in winter, other factors that contribute to the surface warming have also changed. For example, the shortwave radiation net has increased in most NAG phases and ablation zones. However, the reasons for this increase vary regionally. Whereas the cloud fraction and content has decreased in the southern parts of Greenland under +NAG allowing more solar radiation to heat the surface, in the northern parts the solar radiation has not increased, but the surface has become darker promoting more absorption of solar radiation. In addition to changes in shortwave radiation net, the near-surface wind speeds have significantly increased in most regions and regardless of the NAG phase. The turbulent mixing of the air near the surface is also one of the factors contributing to the snow/ice surface warming. The causes for the wind-speed increase are still uncertain. However, the less frequent and thinner sea-ice nearby the northern Greenlandic coastal margins can be playing a role and help to explain the wind speed strengthening by larger surface-pressure differences between the low ice sheet areas and the adjacent seas.
Humans amplify climate forcing
The greater warming of the Arctic compared to mid-latitudes is referred to as Arctic Amplification. The Arctic Amplification has been extensively studied in order to understand its cause, sources, feedbacks and influences in the region. To date, this study is the first differentiating warming contributions to the surface energy components over the GrIS as dependent on the atmospheric configuration. Nevertheless, key drivers of Arctic Amplification go beyond large-scale atmospheric processes, as the mechanisms leading to it are complex and interrelated. This makes it challenging to quantitatively differentiate the anthropogenic vs natural radiative forcing. Notwithstanding, the effect of anthropogenic greenhouse emissions on warming the atmosphere and modifying Greenland Ice Sheet energy balance is nowadays unarguably.
Media information
Written by Tiago Manuel Ferreira da Silva
Edited and layout by the APRI-media team
Contact: use our contact form.
Header photo: © Christoph Ruhsam, www.pure-landscapes.net
About the scientific author
Tiago Manuel Ferreira da Silva, University of Graz, Austria
Review status: The publication (preprint) is currently under review for the journal The Cryosphere.